
Update2026.11.10 (화)


[WSJ: “Actual Growth Rate Is Close to 0%”]
Doubts surrounding the true state of the Chinese economy are escalating into questions over the reliability of its official statistics. While Beijing evaluates itself as on track toward its targets with 4.6% growth in the first three quarters of this year, U.S. research firms estimate that actual growth stands at merely 0% to 2%. Once the froth of growth is stripped away, the numbers become far more sobering. The per capita income gap between the United States and China, which had narrowed for two decades, bottomed out in 2021 and is widening once again. Xi Jinping's blueprint—promising “more satisfactory income” in 2012 and asserting in 2020 that doubling income by 2035 was “entirely feasible”—is now losing its grounding. Beijing’s emphasis on being the “world’s largest economy” based on Purchasing Power Parity (PPP) ultimately serves to mask this disparity.
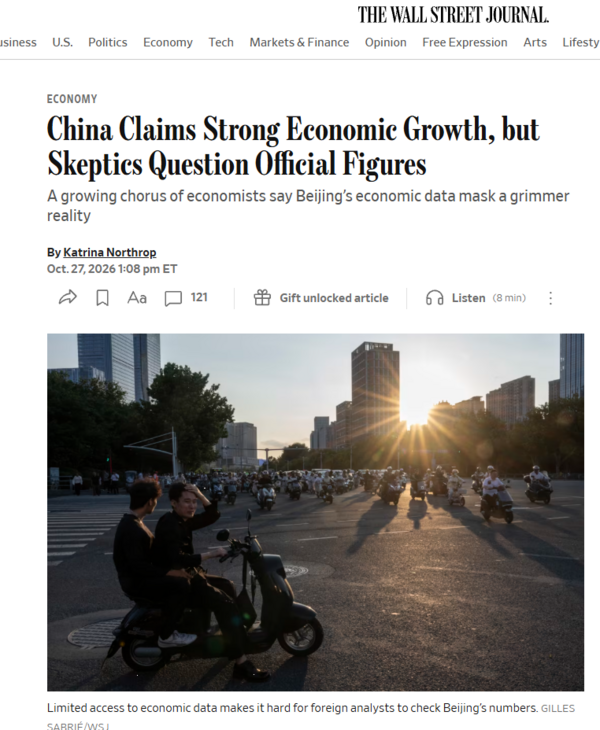
The Wall Street Journal (WSJ) reported on the 28th that “U.S. economic research firm Rhodium Group estimated China’s actual growth rate this year to be around 0%,” noting that “Rhodium concluded that achieving 4.5% growth is impossible amid sluggish retail sales and sharp declines in fixed-asset investment.”
British research firm Capital Economics also estimated the actual third-quarter growth rate at around 2%. This stands in stark contrast to the release by China’s National Bureau of Statistics (NBS). On October 19, the NBS reported third-quarter growth of 4.5% and a cumulative 4.6% for the first three quarters, claiming the annual target of 4.5% to 5% remains within reach. The WSJ also questioned the credibility of the official data showing the surveyed urban unemployment rate falling slightly to 5.2% in September.
The grounds for skepticism are embedded within the NBS’s own releases. From January to September, fixed-asset investment fell by 7.2% year-on-year, while private investment plunged 10.4% and real estate development investment dropped 20.6%. With investment—a primary pillar of the economy—crumbling to this degree, it was exports that kept growth afloat. Goods trade expanded 18.8% over the same period, but domestic demand remains weak. The NBS acknowledged in its own assessment that the shortfall in domestic demand is prominent. Max Zenglein, senior economist for the Asia-Pacific at the U.S. economic research group The Conference Board, told the Associated Press (AP) that the official growth rate is “becoming less and less useful as a proxy for the broader economy.”
Rhodium’s doubts did not surface for the first time this year. In a report published in December last year, Rhodium estimated China’s real growth rate for 2025 at 2.5% to 3.0%—about half the official figure of 5.0%—and 2024 at 2.4% to 2.8%. Rhodium pointed out that no economy in history has recorded 5% real growth while enduring multiple years of deflation. It also estimated that accumulated overstatements mean China's actual economy is likely around 11% smaller than official figures suggest.
There are counterarguments. While the IMF lowered its forecast for China’s growth this year to 4.5% in October, it aligned with the lower boundary of the official target, and some Western economists argue actual growth does not diverge significantly from official numbers. Regardless of which assessment proves accurate, the conclusion points in the same direction: China's pace of catching up with the United States is far slower than Beijing’s propaganda claims.
Even according to China’s official statistics, the 2025 per capita disposable income of urban residents was 56,502 yuan (approximately 11.35 million KRW) compared to 24,456 yuan (approximately 4.91 million KRW) for rural residents—a gap of about 2.3 times. For ordinary citizens, policies that close this gap affect daily living far more directly than aggregate economic rankings. The phrase “world’s largest economy” alone cannot explain the lived reality of rural and low-income households.
[Widening Per Capita Income Gap Between the U.S. and China]
According to the IMF’s 2026 World Economic Outlook (WEO), nominal per capita GDP this year is projected at $94,430 (approximately 126.14 million KRW) for the United States and $14,874 (approximately 19.87 million KRW) for China. The absolute gap between the two countries is expected to widen by 9.4% between 2024 and 2026, approaching nearly $80,000 (approximately 107 million KRW). Long-term trends make the significance clear: the ratio, which stood at around 38 to 1 in 2000, narrowed rapidly to 10.6 to 1 in 2010 and 5.5 to 1 in 2021 during China’s era of rapid ascent as the “world’s factory.” After hitting that trough in 2021, however, the gap has expanded back to 6.3 to 1. This calculation assumes China's official figures are accepted at face value; if the growth rate is inflated as Rhodium estimates, the real divide is even wider.
[The ‘Optical Illusion’ Created by a Low Starting Point]
China's early rapid growth stemmed from its extremely low initial base. According to analysis by Dr. Antonio Graceffo, an economist who has studied the Chinese economy for over two decades, China’s per capita GDP of $3,879 (approximately 5.18 million KRW) in 2009 roughly matched the purchasing-power-adjusted per capita GDP of the United States in 1870 (nominally around $229 to $252 at the time, or roughly 310,000 to 340,000 KRW). It took until the early 21st century for China to reach the post-Civil War level of the United States. Double-digit growth is relatively easy to achieve from such a foundation. China grew by 10.4% in 2010, right before Xi took office. As the size of the economy expanded and structural constraints like demographic decline and the property bubble surfaced, its growth engine cooled rapidly.
[The Promise of Being “Entirely Feasible”: That Was the ‘Chinese Dream’]
At his first press conference after taking office as General Secretary in November 2012, Xi Jinping stated, “Our people love life and yearn for better education, more stable jobs, and more satisfactory income.” He additionally pledged “more reliable social security, higher-level medical and healthcare services, more comfortable living conditions, and a more beautiful environment.” In November 2020, while explaining the proposals for the 19th Central Committee's Fifth Plenum, he openly declared that it was “entirely feasible (完全有可能)” to double total economic output or per capita income by 2035 from 2020 levels. Economists calculated that achieving this target would require sustained average annual growth of around 4.7% across 15 years.
Reality has moved in the opposite direction. Premier Li Qiang presented a 2026 growth target of “4.5% to 5%” at the National People’s Congress in March. The AP and the South China Morning Post (SCMP) evaluated this as the lowest official target set since 1991. Second-quarter official growth came in at 4.3%, falling below even this target range. Bloomberg noted it was the weakest pace since the 2022 pandemic lockdowns. The rebound in the third quarter was carried primarily by exports, while investment and private consumption remain subdued.
[PPP as an ‘Advantageous Yardstick’: Blinding the Public!]
Beijing employs PPP metrics rather than nominal U.S. dollars to make the wealth gap appear smaller. PPP adjusts for national price differences to compare standards of living. The logic suggests that because goods and services are cheaper in China, a Chinese citizen earning $15,000 (approximately 20.04 million KRW) annually can enjoy a living standard comparable to an American earning considerably more. Under this measure, China’s 2026 GDP stands at $44.3 trillion, roughly 37% larger than the U.S. total of $32.4 trillion. On a nominal basis, however, the U.S. economy ($32.4 trillion) is roughly 55% larger than China’s ($20.9 trillion).
Drilling down to individual citizens, PPP fails to offer a favorable picture for China either. Although China's per capita GDP on a PPP basis stands at $31,596—more than double its nominal figure—the average American remains roughly three times richer even under this adjusted metric. Furthermore, real-world cross-border commerce occurs in actual currencies, not “PPP dollars.” PPP adjustments provide no relief when purchasing goods subject to global market pricing, such as imported items, overseas travel, advanced technology, or overseas education. Because PPP figures represent macro averages, they also obscure income inequality. In effect, Xi is using an inflated PPP narrative to mislead both domestic and international audiences.
[The ‘Average Chinese Citizen’ Falling Below the U.S. Poverty Line]
According to poverty guidelines published by the U.S. Department of Health and Human Services (HHS) in January this year, the poverty threshold for a single-person household in the 48 contiguous states is $15,960 (approximately 21.32 million KRW) annually. China’s nominal per capita GDP sits below this threshold. Using per capita GDP as a rough benchmark for average income, the average Chinese citizen's income is comparable to the qualifying threshold for the U.S. Supplemental Nutrition Assistance Program (SNAP/food stamps). Actual household conditions are tighter still: per capita disposable income recorded by the NBS in 2024 was around 41,000 yuan (approximately $5,700, or about 7.61 million KRW), representing only about 40% of per capita GDP. This clearly reveals a structural issue where the fruits of growth do not sufficiently trickle down to households.
[‘Surpassing the U.S.’ Pushed Past the 2040s: A Fading Pipe Dream]
Xi’s central goal of “surpassing the United States” is slipping further away. While the UK’s Centre for Economics and Business Research (CEBR) projected in 2020 that China would overtake the U.S. by 2028, current data renders that timeline implausible. According to calculations by Dr. Graceffo, even if the U.S. grows at 2% annually and China maintains 4.5%, an overtake in aggregate GDP would not materialize until around 2044.
Applying the 4.17% annual growth rate that Shen Danyang, director of the State Council Research Office, stated in March as necessary to hit the 2035 targets, the crossover point gets deferred to around 2047. On a per capita GDP basis, calculations project that the two nations would not reach parity until roughly 2085. All these projections presume China's official growth figures are valid. If Rhodium’s estimate of near 0% growth is closer to reality, a crossover may not occur within this century. This is the unvarnished reality of the Chinese economy.
[Why Times Insight]
The debate over statistics covered by the WSJ is not merely a question of discrepancies in percentage points. The Chinese Communist Party has long justified curbs on political freedoms by promising consistently improving living standards year after year. The GDP growth rate was the ledger certifying that this social compact was being fulfilled. As global confidence in that certification erodes, the per capita income gap is widening once more.
Beijing’s reliance on PPP-based claims of being the “world’s largest economy” and nationalist narratives represents an attempt to paper over individual-level shortfalls with state-level prestige. The pledges of “more satisfactory income” and an “entirely feasible” doubling of wealth will almost certainly remain unfulfilled during Xi Jinping's lifetime. This is precisely why observers increasingly argue that Xi's policies have derailed China's progress.


-중국 푸단대학교 한국연구원 객좌교수
-전 EDUIN News 대표
-전 OUR NEWS 대표
-제17대 대통령직인수위원회 정책기획팀장
-전 대통령실 홍보기획비서관
-사단법인 한국가정상담연구소 이사장
-저서: 북한급변사태와 한반도통일, 2012 다시우파다, 선거마케팅, 한국의 정치광고, 국회의원 선거매뉴얼 등 50여권